
EPM is the discipline. LINQ makes it practical.
Model your business processes visually, and LINQ calculates time, cost, capacity, carbon and value for every part of the flow as you build. A process map becomes a living digital twin you can test change against.
No credit card required.
Everything you need to see, solve and share
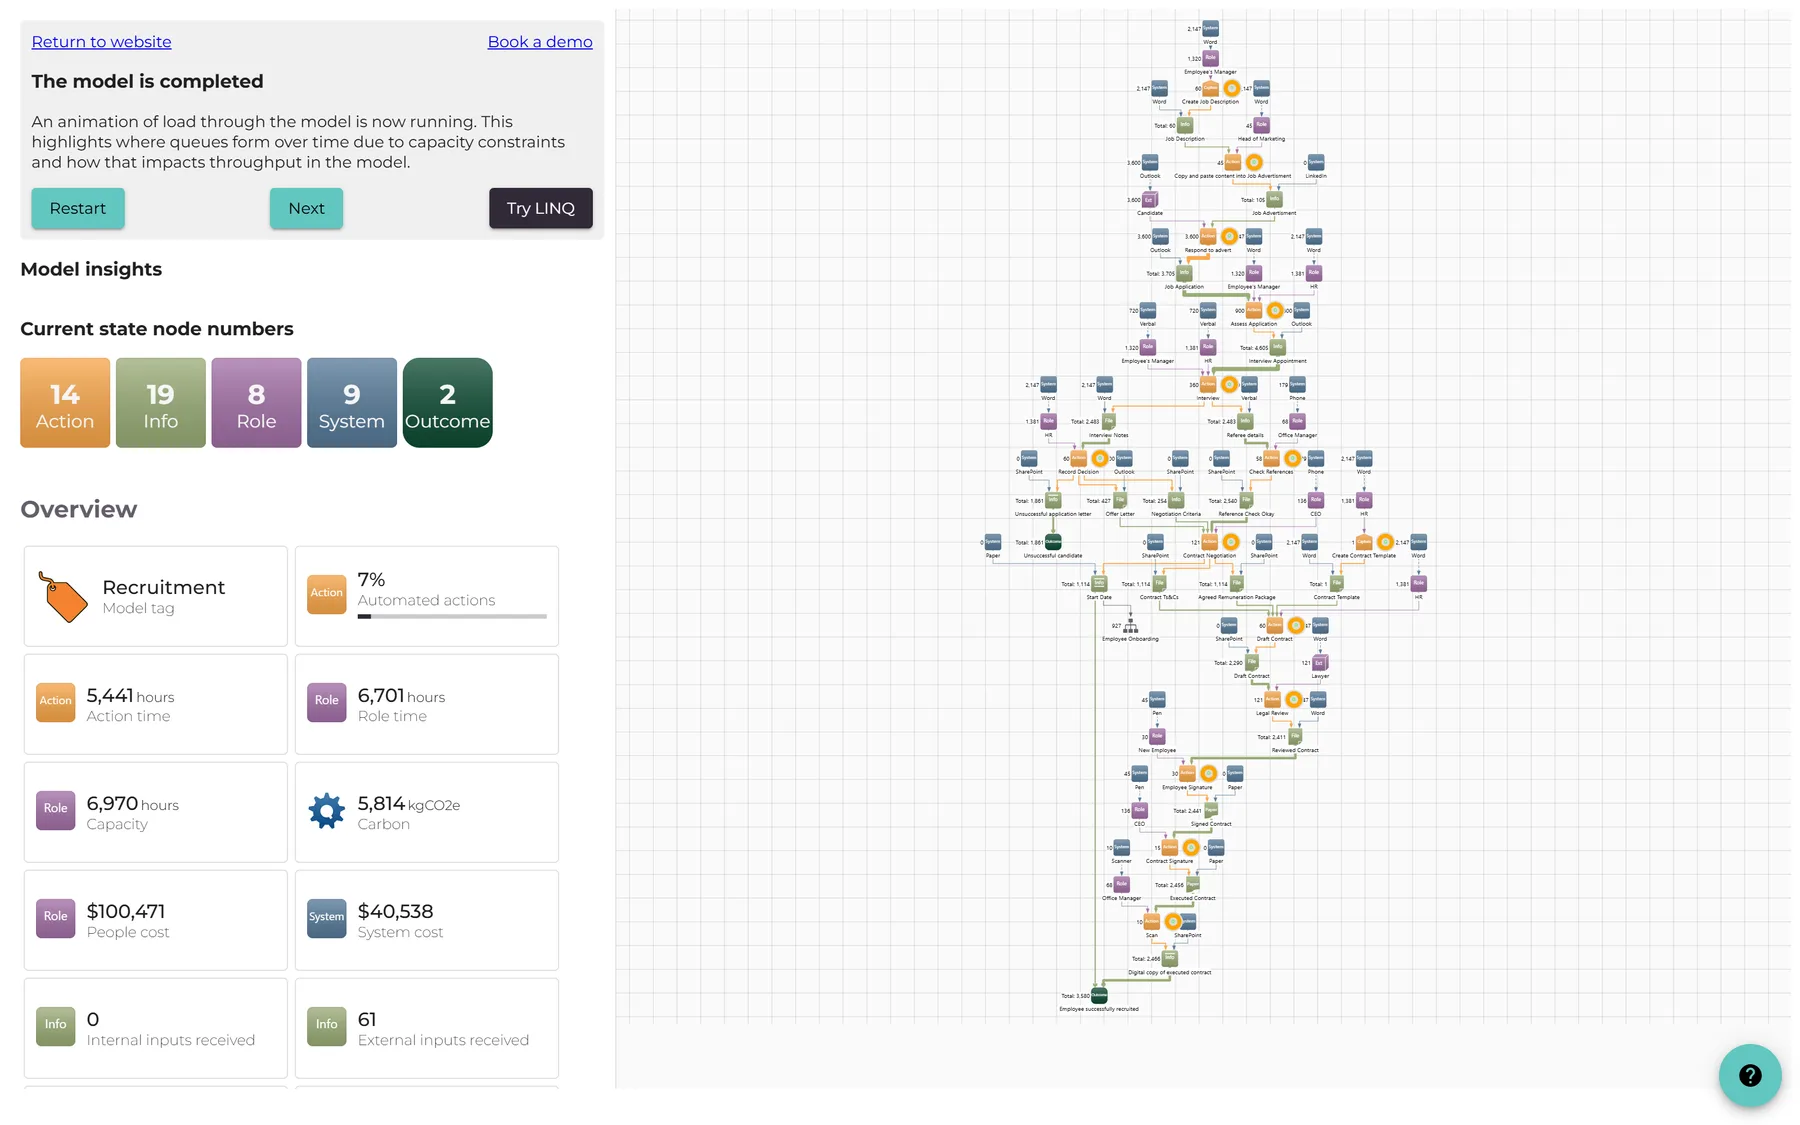
Visualise information flows
Transform complex processes into clear, actionable insights with interactive digital twins.
Identify bottlenecks and inefficiencies
Pinpoint where time, money and effort are being wasted.
Optimise decision-making
Make data-driven choices to improve operations and reduce risk.
Improve collaboration
Align teams with a shared understanding of how information supports business goals.
Four building blocks for any business
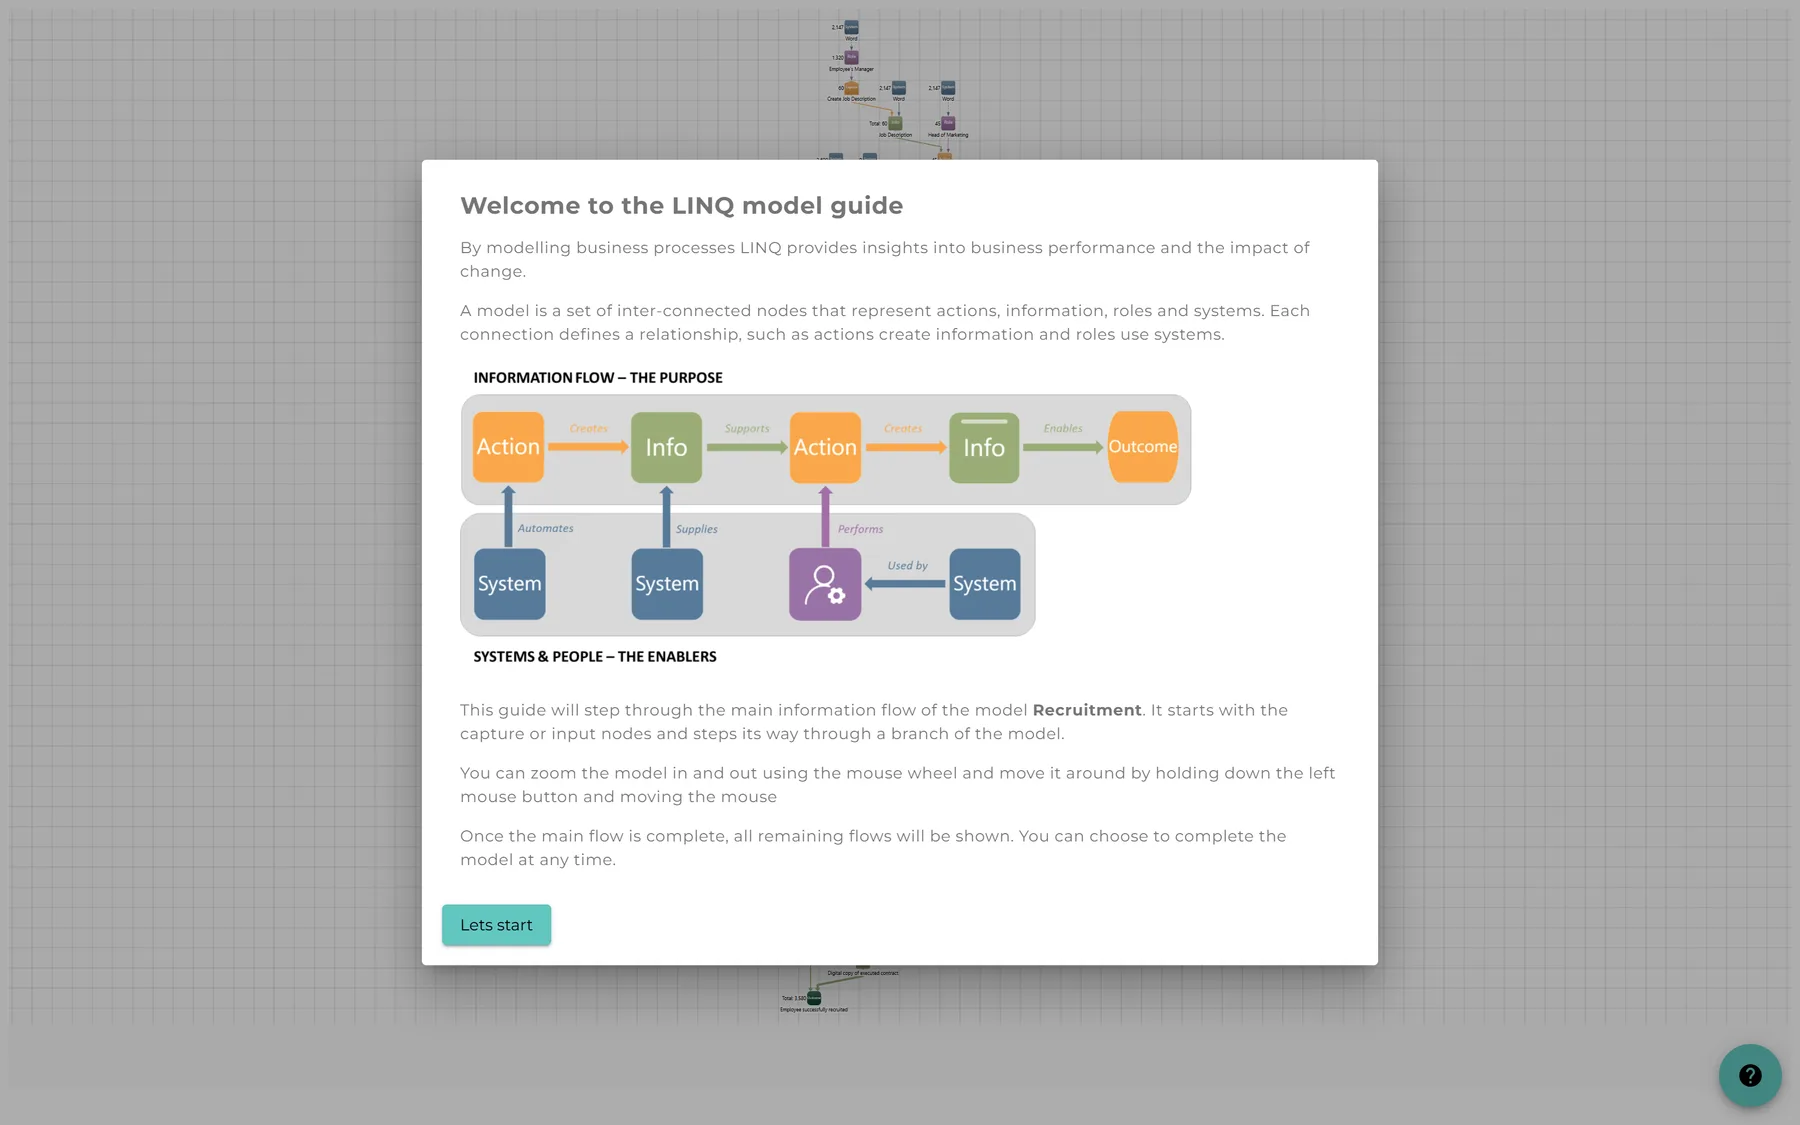
A structured language for business modelling that is domain independent, simple to learn and simple to use. It gives you a repeatable template for capturing information quickly, and a consistent representation of procedures.
- Actions represent work done.
- Information represents value created by actions.
- Roles perform actions. They define skills and capacity.
- Systems are tools used to execute actions.
One analysis tool instead of many
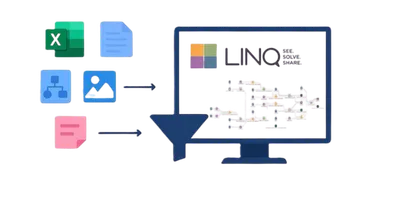
- Replaces the drawing capability of Visio, Canva or Mural
- Replaces the manual calculations of Excel
- Replaces the documentation capability of Word
- Online storage, backup and collaboration
Create models fast
Easily map out how your organisation creates, transforms and shares information to uncover hidden inefficiencies. Use AI to create a best practice model of your process, then collaborate with staff to adjust and quantify it.
- Start with a single process
- Use AI to create a best practice model of your process
- Collaborate with staff to adjust and quantify the model
- Model more processes and join them together to understand how the organisation works as a whole
- Use AI to create executive summaries
- Generate Standard Operating Procedures (SOPs)
Gain insights and visuals
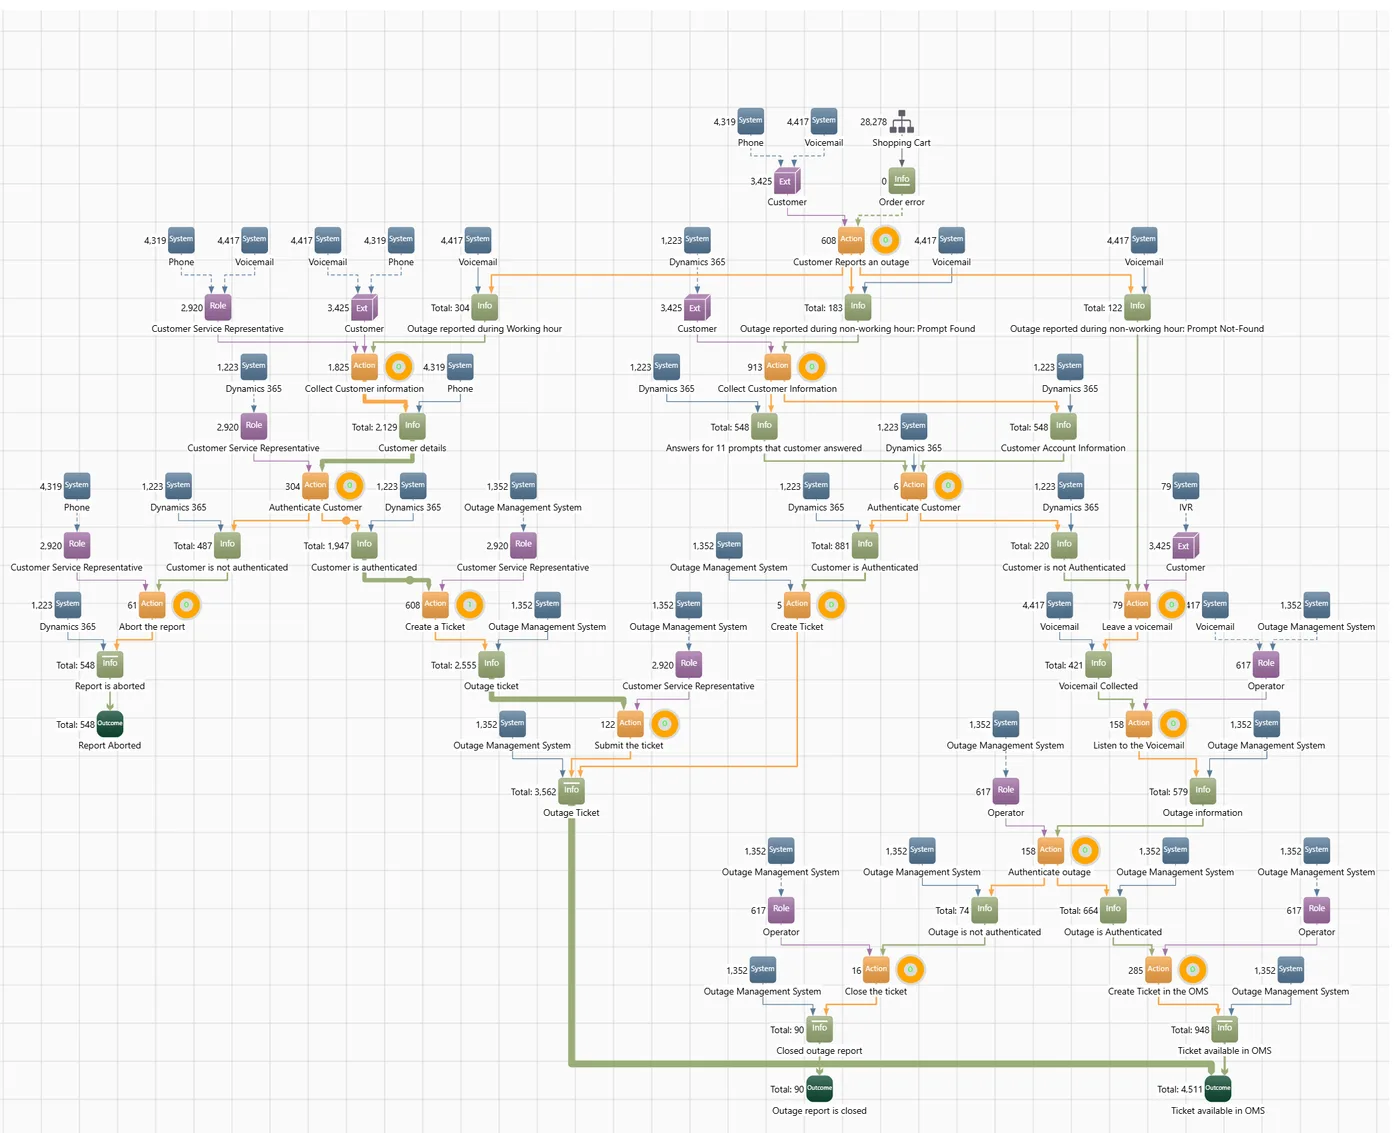
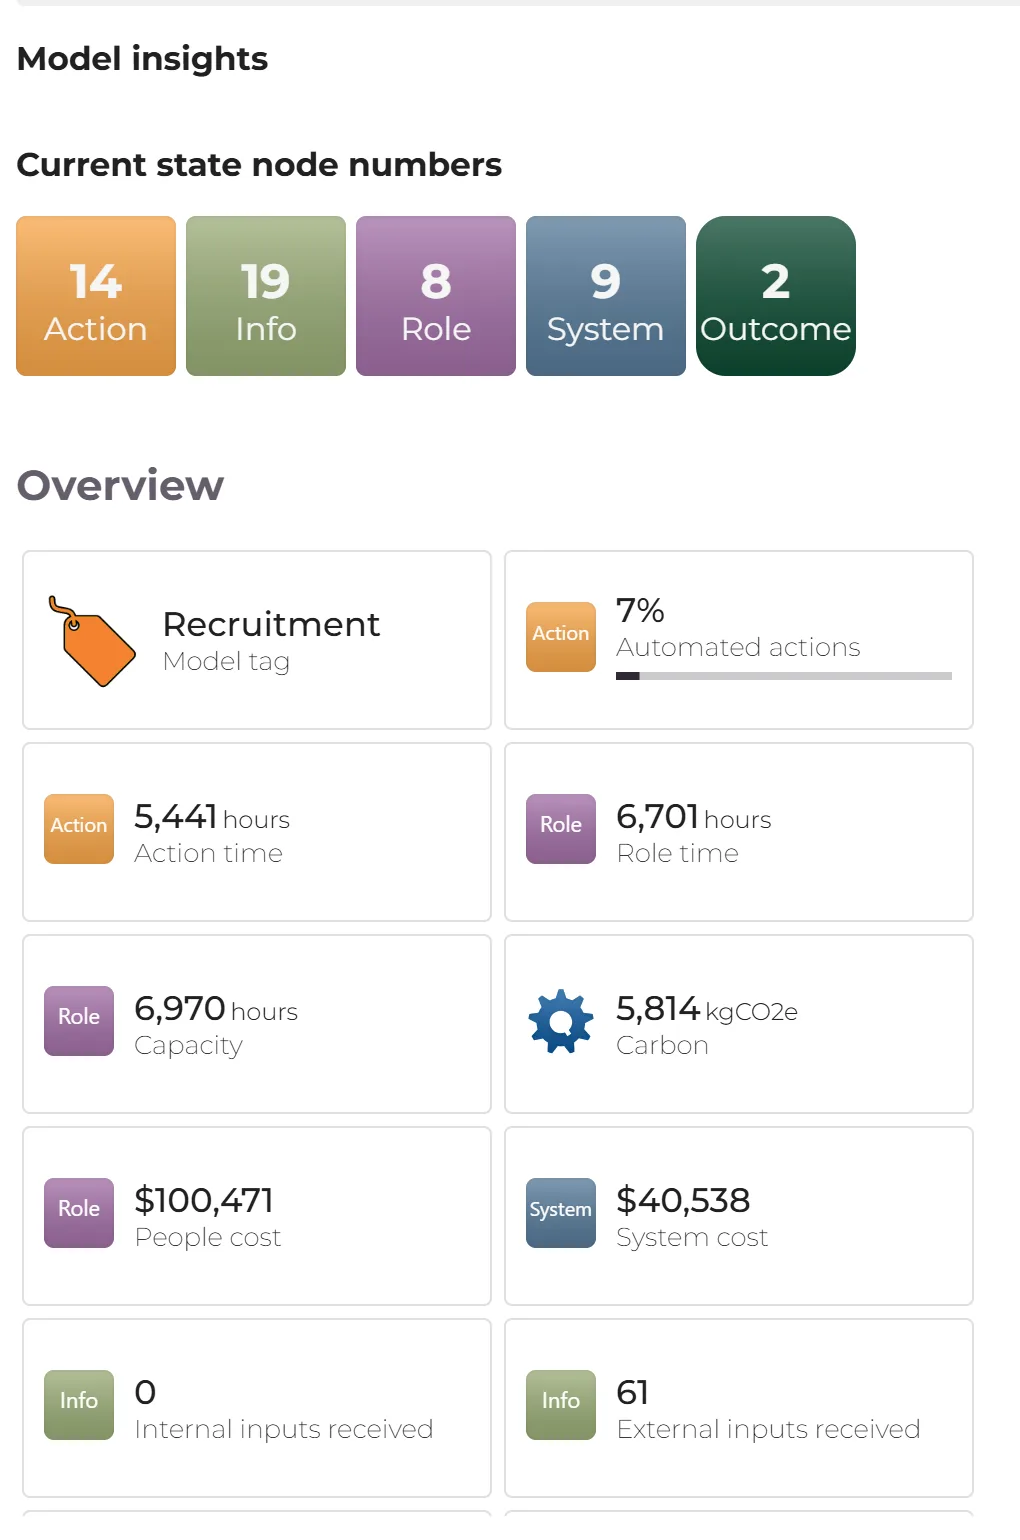
LINQ automatically calculates insights for production, time, costs, capacity, workload, carbon emissions and value.
- Run temporal models to see work heatmaps highlighting where capacity constraints are creating queues
- See the impact of changing production on staff and equipment
- Visualise data from different perspectives
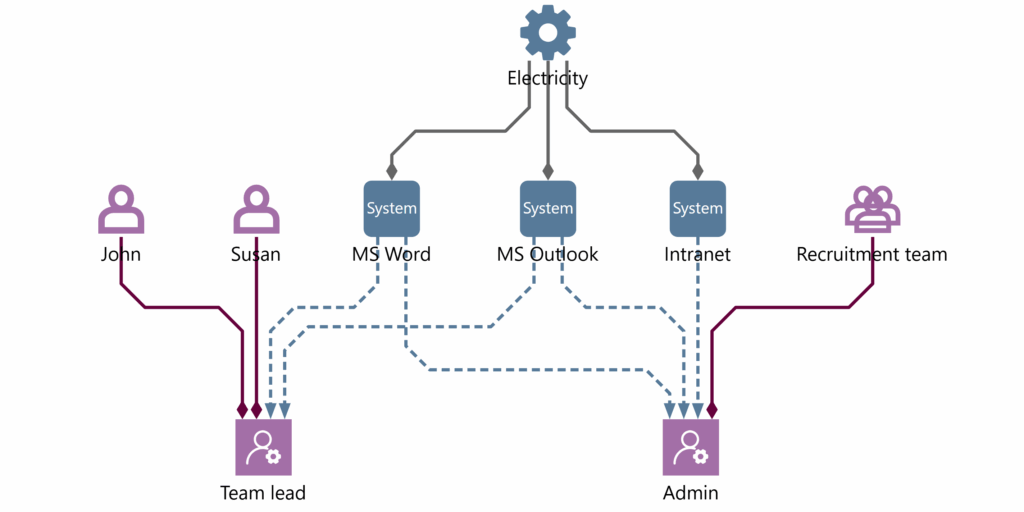
People, roles, systems and infrastructure
Assign people to roles with capacity and cost, and test workloads to reveal bottlenecks and queues.
- Add people to roles and set capacity and costs
- Run the model with different loads to view capacity constraints and queues
- Visualise role requirements and the skills or training that may be required
- Add infrastructure to allocate Scope 1, 2 and 3 carbon emissions
- See the allocation of costs and compare it with the value created
- See the impact and requirements of changing systems
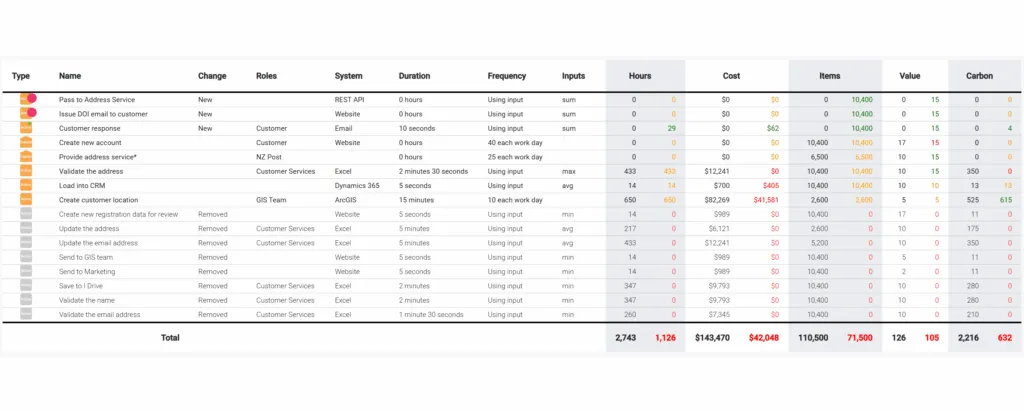
Model change and view impact
Model changes to your organisation, such as process automation, implementing AI or continuous improvement. Compare the new model with your current state, and generate a serious business case and plan for real change.
- Compare the new model with your current state
- See the impact on time, costs, carbon, systems and people
- Generate a business case and create a plan for change
Model your business in one platform
Start modelling for free with up to 150 nodes. No credit card required. Or book a call and we will walk you through LINQ with your own process.
Not ready to sign up? Walk through a real LINQ model