
← All release notes

Deep model insights

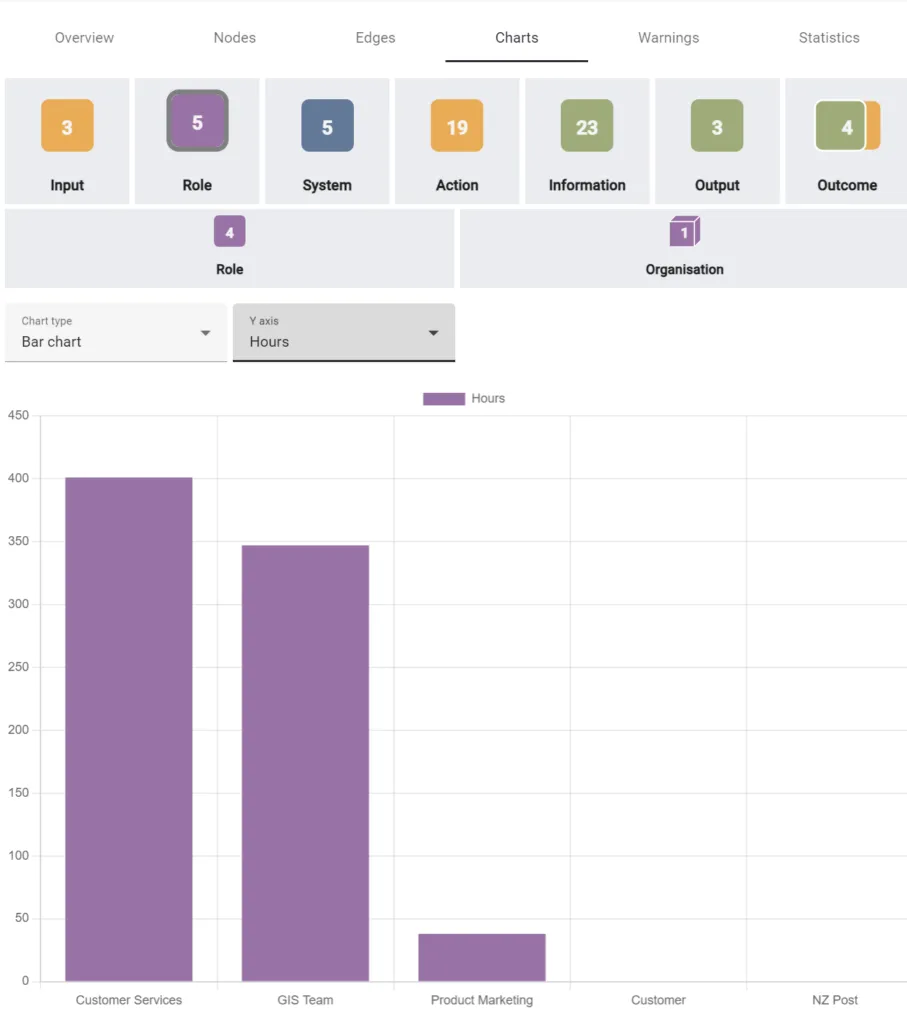
LINQ insights showing a bar chart of people and the hours they spend doing the work captured in the model. The user has control over the way data is presented, and which data is used.

We’re giving you control in how you choose to present the data captured in your models. The upgraded insights panel allows you to select the node type and the data you want to show.

Insights can be controlled through data filters and selections so you can dig into the content you need to create the narrative required to support decision making.

See what your processes are actually worth

Bring one process that matters and we will score it with you, or start modelling for free with up to 150 nodes.

Not ready to sign up? Walk through a real LINQ model