
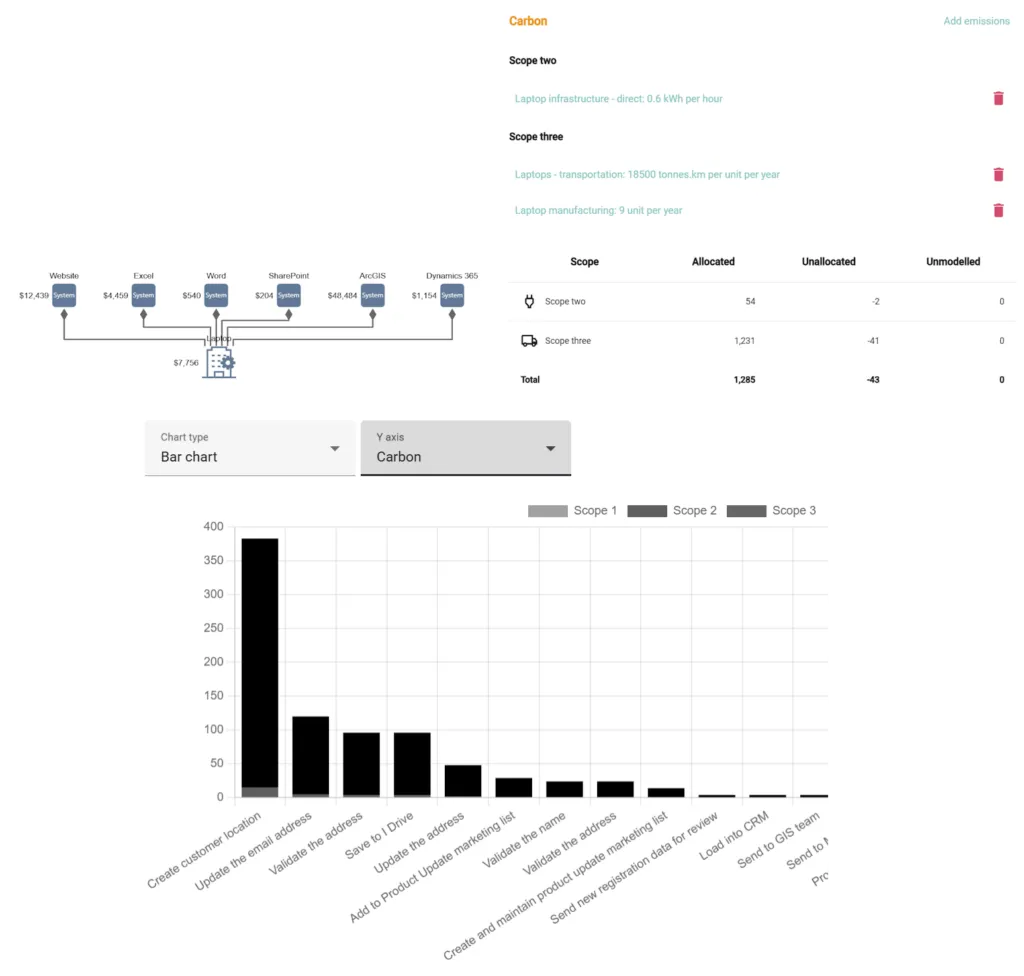
Now you can connect infrastructure to your systems. This means you can show how systems are used across your organisation, whether on-premise or in the Cloud. It’s as simple as connecting them up in the People & Systems model.
Once you have infrastructure in place, you can define direct (Scope 1 & 2) and indirect (Scope 3) emissions for your infrastructure. Our calculator makes it easy to set up emission factors and apply them to your supply chain. LINQs allocation metholdogy applies emissions at the organisation level against your systems and in each model at the action and system level.
You can now see the carbon intensity of the way you work today, and the carbon intensity of your planned change. Finally you can see which actions create the most carbon, what action to take to reduce your carbon, and the impact of your change in terms of carbon, alongside cost, time, and value.